There are no items in your cart
Add More
Add More
| Item Details | Price | ||
|---|---|---|---|

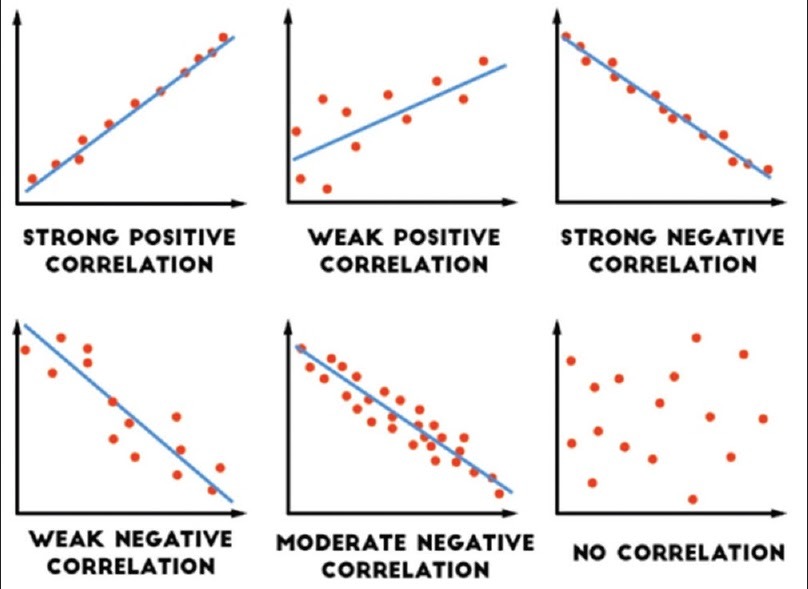
This term is used to describe the relationship or link between two variables. If an increase in one variable is matched by an increase in the other variable (the line points up) then there is a positive correlation. If the line points down it is a negative correlation. If the data points are scattered it is a weak correlation, if the data points are close to the line then it is a strong correlation.
A common mistake is to assume that a correlation implies a causal link. This may not be correct. Ice cream sales and umbrella sales are both affected by the weather, but not by each other. If you plot a graph of ice cream sales on one axis and umbrella sales on the other you will get a strong correlation - they do not have a causal link (they don't affect each other) - they just have a common cause.
 Launch your Graphy